AI Traffic Unpredictability
Backblaze's Q2 2026 Network Report Highlights Unpredictable Nature of AI Traffic Variance
Anonymous
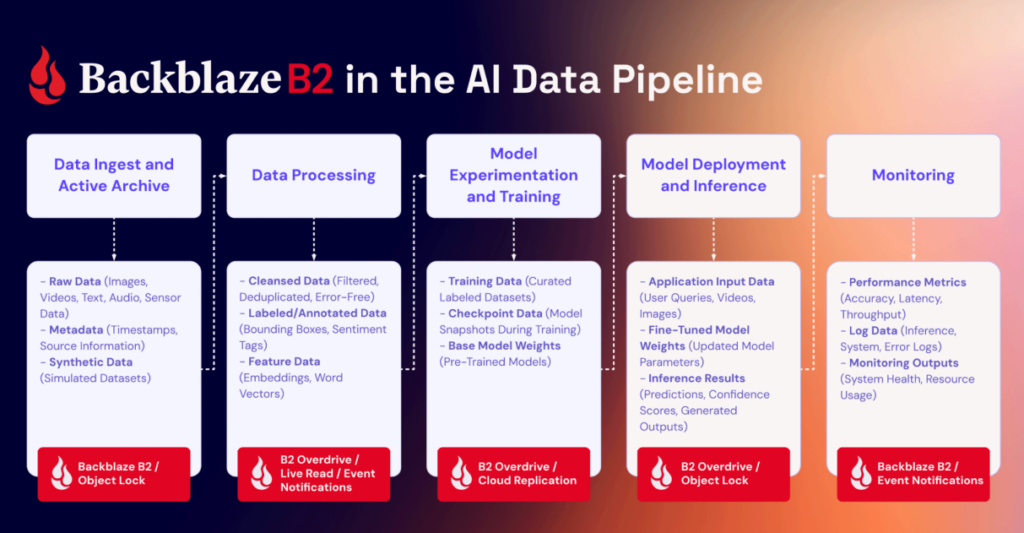
Backblaze has published its Q2 2026 Network Stats report, and the headline finding is stark: AI-driven traffic is far less predictable than traditional internet traffic. The company used 10-minute traffic samples to build a new variance-based analysis — a way of measuring not just how much data moves, but how erratically it moves. National Post reported the findings show neocloud and hyperscaler traffic behave in ways that set them apart from conventional workloads.
The full report, including variance charts, traffic-type breakdowns, and geographic heatmaps, is available on the Backblaze blog. Backblaze will also host a live webinar on July 28, 2026, to walk through the data with network and market intelligence experts.
What Variance Analysis Actually Measures and Why It Matters
Most network reports count total data moved. Backblaze went a step further. Its new variance analysis looks at how wildly traffic levels swing from one 10-minute window to the next. A low-variance workload is steady and easy to plan for. A high-variance workload spikes and drops without warning, making infrastructure planning much harder.
This distinction matters for companies building AI infrastructure. Unpredictable traffic means you either over-provision — wasting money — or under-provision and face slowdowns. By measuring variance directly, Backblaze is giving the industry a clearer picture of what AI workloads actually demand from a network.
Neocloud and Hyperscaler Traffic Show High Volatility
The report's sharpest finding is that neocloud and hyperscaler traffic — the kind tied to AI model training and inference — shows high volatility compared to traditional internet traffic. The Sudbury Star and Edmonton Sun both noted this contrast as the core takeaway of the Q2 data. These traffic types swing dramatically, unlike the relatively smooth curves seen in standard consumer or enterprise workloads.
Neoclouds are smaller, specialized cloud providers built specifically to run AI workloads. Hyperscalers are the giants — think large-scale data center operators. The fact that both categories show similarly erratic traffic patterns suggests the volatility is a feature of AI workloads themselves, not just of one type of provider.
New Time-Series Dataset Drives the Findings
To produce this analysis, Backblaze built a new time-series dataset drawn from 10-minute traffic samples across its network. Sampling at that frequency — 144 data points per day — captures short bursts and sudden drops that hourly or daily averages would smooth over and hide. National Post described this methodology as central to separating stable traffic from volatile AI-driven flows.
The report also includes geographic heatmaps showing where traffic spikes cluster across regions. That spatial layer adds context to the variance numbers, helping engineers see whether volatility is concentrated in specific data center hubs or spread more broadly across the network.
July 28 Webinar to Unpack the Data Live
Backblaze will host a live webinar on July 28, 2026, featuring Brent Nowak, Manager of Network Engineering, and Stephanie Doyle, Senior Manager of Market Intelligence. The two will walk through the variance findings, the traffic-type breakdowns, and what the data means for companies planning AI infrastructure. Shoreline Beacon confirmed the webinar is open to the public.
For anyone building or buying AI infrastructure today, the core message from the Q2 report is simple: plan for chaos. AI traffic does not move in smooth, predictable lines. It spikes, drops, and spikes again — and Backblaze's new variance framework is one of the first public tools designed to measure exactly how bad that unpredictability really is.
Sentiment
NeutralNEGATIVENEUTRALPOSITIVE
Publishers
5
Articles
5
Reach
5
Topics
A
AnonymousAuthor


